You should spend about 20 minutes on this task.
The graph below shows the consumption of fish and different kinds of meat in a European country between 1979 and 2004.
Summarise the information by selecting and reporting the main features and make comparisons where relevant.
Write at least 150 words.
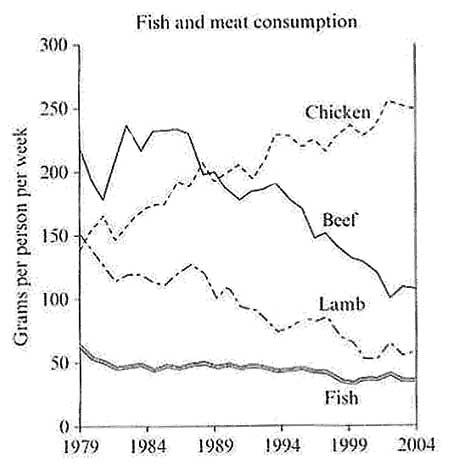
The biggest consumption in 1979 was beef (about 220 grams per person was consumed every week) while the lowest consumption in 1979 was fish (around 60 gram per week was consumed by a person). The amount of fish which was eaten has remained almost constant at about 50 grams from 1979 and 2004. The trends of beef and lamb consumption were similar, with decreases in amount in between the years. While beef consumption had declined from over 200 grams per person per week to around 100 grams during 25 years, lamb’s was starting 150 grams to approximately 50 grams at the same period.
In contrast, chicken consumption had grown up gradually to year of 194, reaching a peak at 250grams per person every week inbetween 1994 and 2004.
This report covers the requirements of the task. The main trends and features were sufficiently developed. The candidate has arranged ideas coherently, though at times they report data in a repetitive way. The range of vocabulary is adequate. There are a few errors in grammar and word choice (mouse over the underlined words shows suggestions for improvement). Overall, this task response meets the expectations and seems good enough to achieve Band 7.

No comments:
Post a Comment